Mobile Dashboards
Within ServiceMonster, Dashboards are used to show you data about your business. These are great for getting a quick look at how your business is doing, and are available on the mobile ServiceMonster app, as well as on the desktop version.
How To See The Mobile Dashboards?
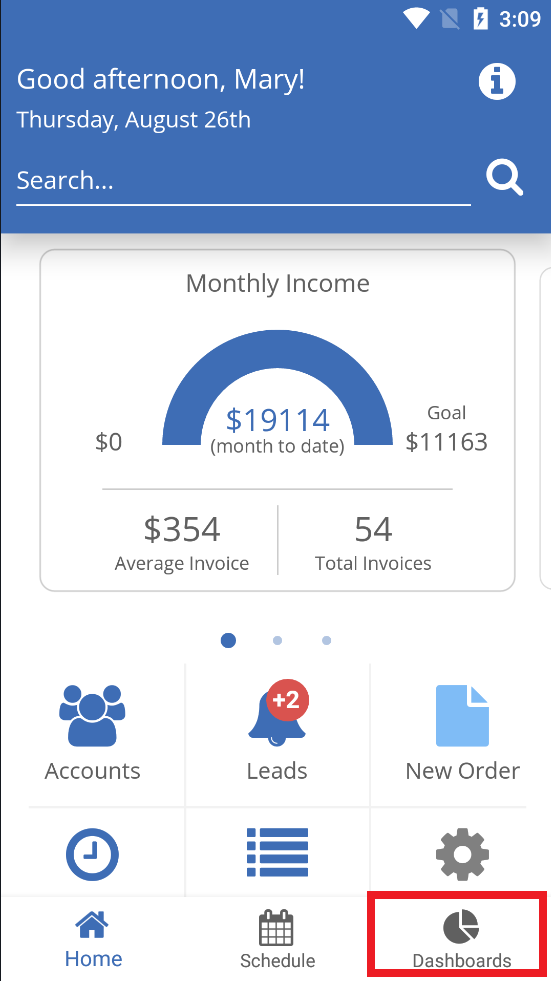
The mobile dashboard page in the ServiceMaster mobile app is home to data and statistics about your business. To access the dashboard page, click on the dashboard button on the lower right-hand corner of the app.
Quick revenue breakdown
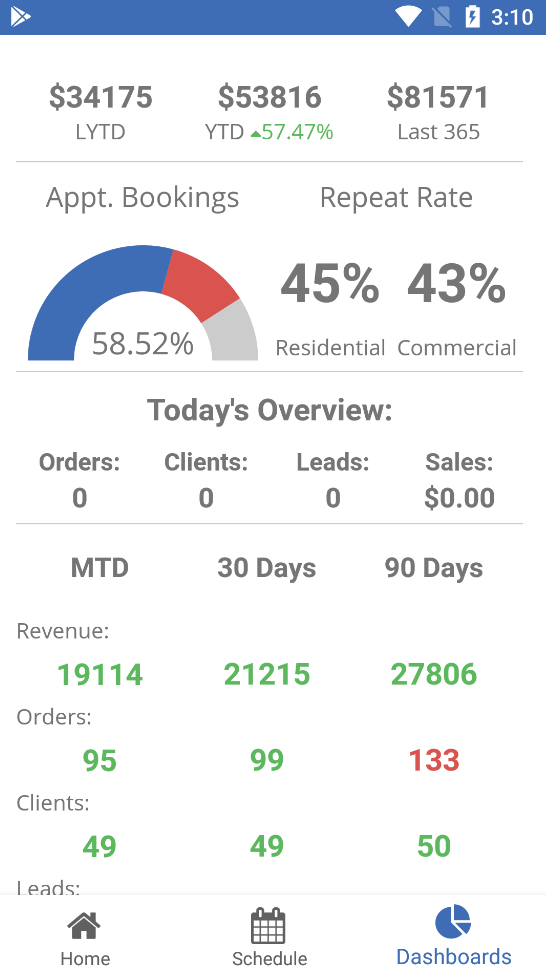
At the top of the page, you can see your LYTD (Last year to date), YTD(Year to date), and Last 365 revenue.
How full is your schedule and how well is your retention working?
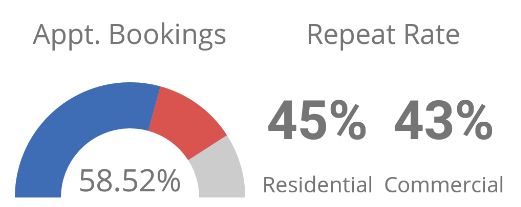
The appointment bookings section shows you how many appointments you’ve booked vs available time, which you can learn more about here. The repeat rate section shows your residential and commercial repeat rates over the last 2 years.
Quick glance for today's work
Today’s overview shows you the number of orders, clients, leads, and total made in sales for the day.

- Orders = any order type created today
- Clients = new accounts created today
- Leads = new leads created today
- Sales = $ amount for invoices completed today
MTD, 30 day, 90 day breakdown
Lastly, you can see your revenue, number of orders, number of clients, and number of leads for MTD (Month to day), 30 days, and 90 days.
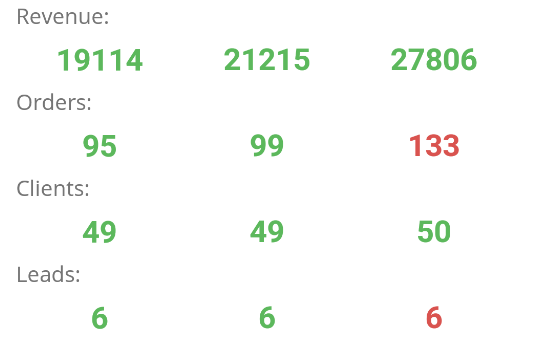
- Orders = any order type created in the date range
- Clients = new accounts created in the date range
- Leads = new leads created in the date range
- Sales = $ amount for invoices completed in the date range
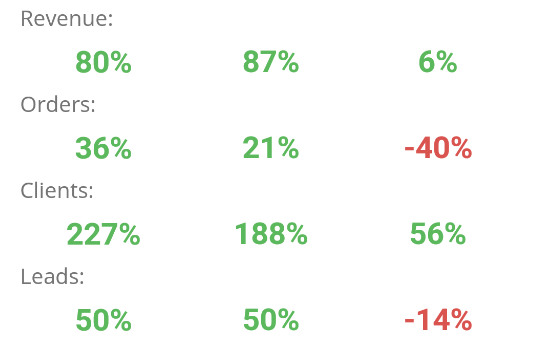
Year-over-year comparison with the tap of a finger!
If you tap on the screen you will be able to change to see the percent change between this time period and the same time period the previous year (year-over-year comparison).
