Home Page: Top Campaigns (90 days)
You can find a graph view of your top Marketing Campaigns from the last 90 days on the Homepage dashboard to quickly see your highest-performing marketing efforts.
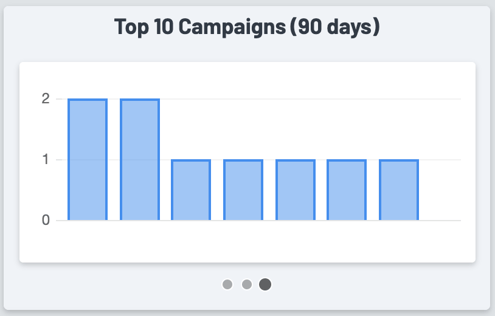
From the Homepage dashboard you can view a bar graph of your top performing campaigns in the last 90 days for some quick stats:

Y-axis (left) = The number of conversions for that campaign.
X-axis (bottom) = The lead source or campaign name.
Frequently Asked Questions:
What is a "lead source" and what's the difference between that and a "campaign"?
- Lead sources are simply identifying which marketing efforts brought in a customer (or repeat order). For all intents and purposes, lead sources and campaigns are identical when comparing results. However, since we use the term "campaign" for our internal marketing efforts and you may as well, we wanted to ensure there was no confusion.
What is a "conversion"?
- A conversion is when an order is invoiced with said lead source attached.
How can I improve campaign results?
- Check out this podcast with our CEO and Marketing Coordinator!
Click here to learn about Top Campaigns from the Marketing Homepage.
