Leads by Month
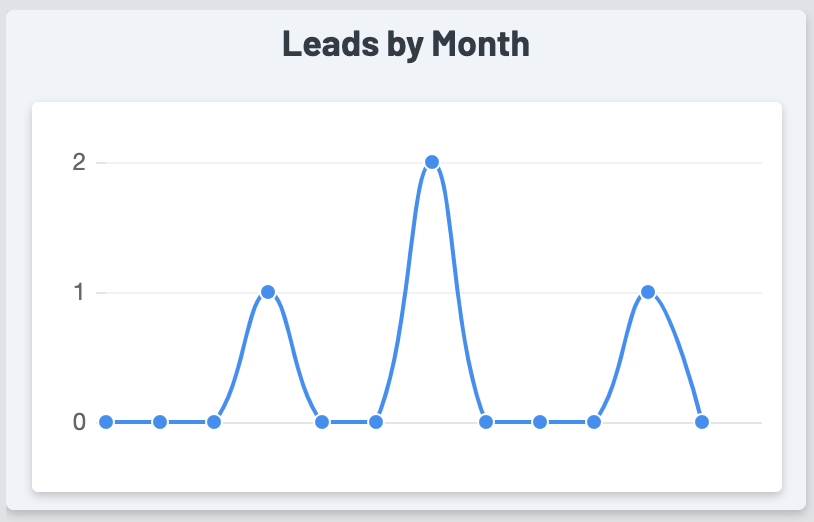
Shows a count of new accepted for each month (declined leads will not be included) in a rolling 12 month period.

- Y-axis (left) = Lead count
- X-axis (bottom) = Month
- Hovering over any of the data points will show you an exact count for that month. Hovering between two data points will show you exact count for both months simultaneously.
