Leads Home Page
The Leads Homepage is your main hub for Leads and opportunities. If you or your sales team utilizes leads or opportunities, this page will be really important.
Leads Homepage Explained
Select "Leads" in the Main Menu, and the Leads Homepage will appear.
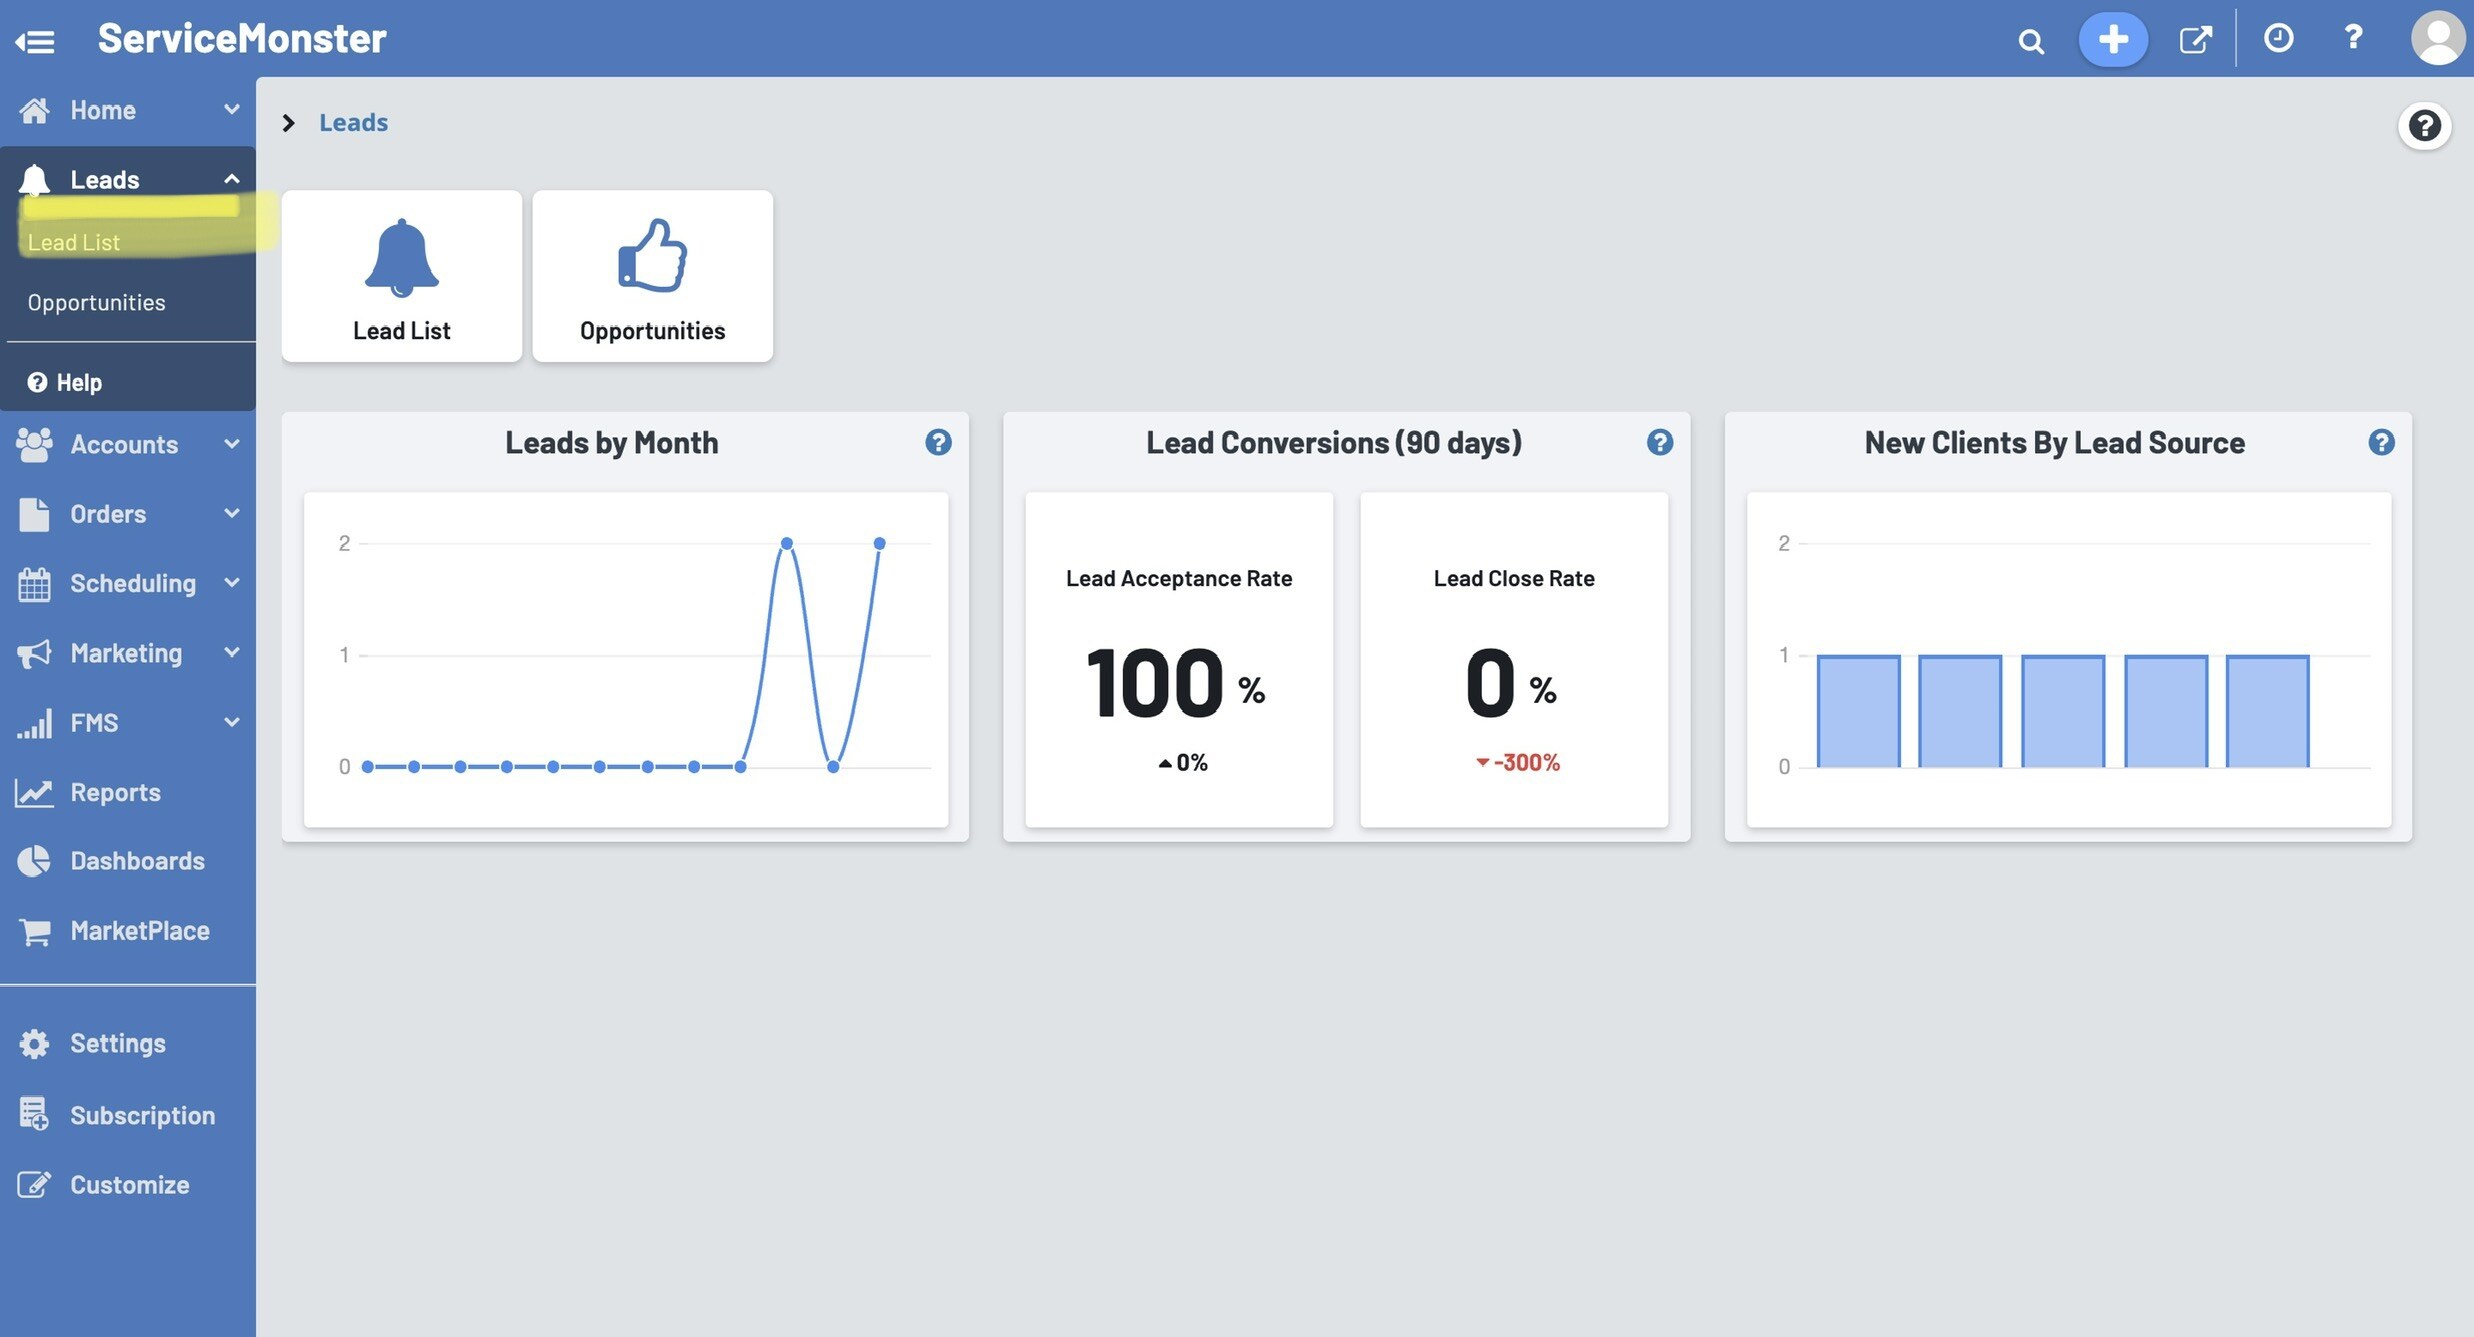
At the top of the page there are two main buttons:
Lead List: Here you can see a full list of your leads, filtered by however you prefer. You can also create new leads here, and view the details of your existing leads.

Opportunities: Here you can see your opportunities board, where you can view and create new opportunities and utilize the Kanban view option.
Next we have three different tables to view. Hovering between two data points will show you the exact count for both months simultaneously.
Leads By Month shows a count of new leads for each month in a rolling 12 month period.
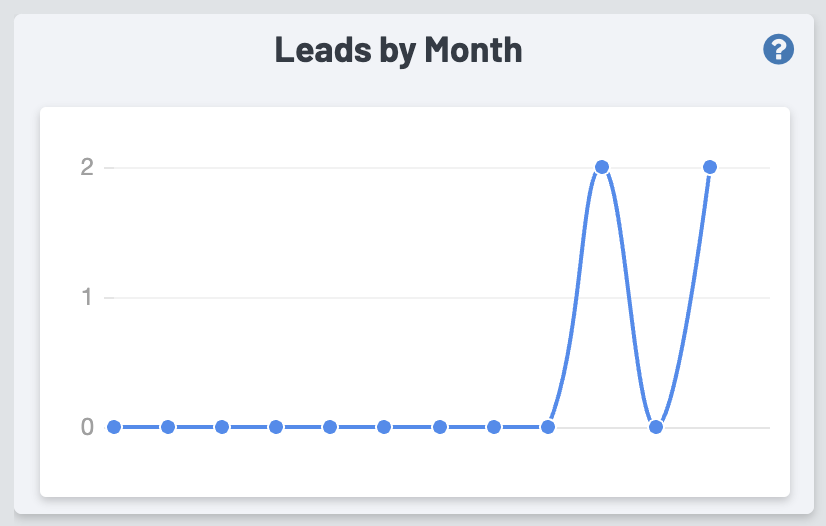
Y-axis (left): Lead count
X-axis (bottom): Month
Hovering over any of the data points will show you the exact count for that month.
Lead Conversions (90 Days) shows the quality of your leads and how many were turned into paying customers in the last 90 days.
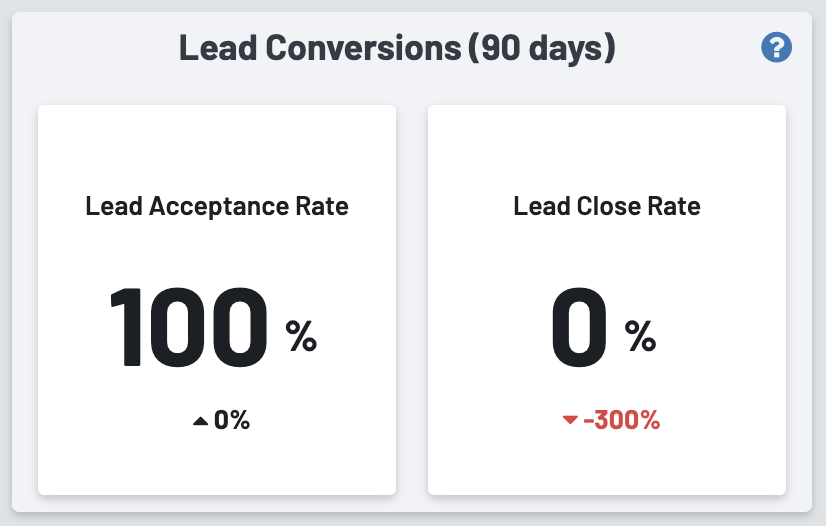
Lead Acceptance Rate:
The larger number shows the % of your leads that were accepted, and hovering over will show the lead count. The smaller number below shows the % of growth (green) or decline (red) from the previous period.
Lead Close Rate:
The larger number shows the % of lead accounts acquired in the 90 day period that completed work.
The smaller number below shows the % of growth (green) or decline (red) from the previous period.
Note: This means the Order needs to be an Invoice to show here. Work Orders and Estimates won’t count.
New Clients By Lead Source shows the different lead sources for newly acquired accounts.
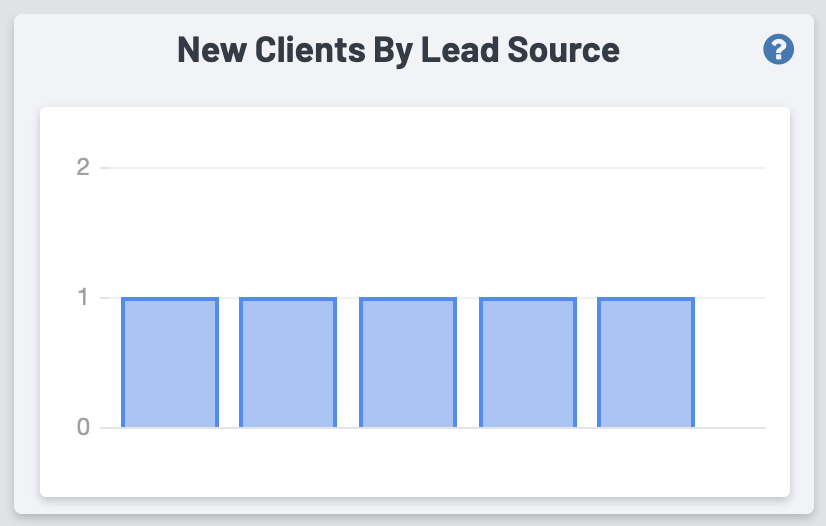
Y-axis (left): Lead source count
X-axis (bottom): Lead source name
Hovering over the bars will show you the lead source name and the exact count of new clients via that source for the newly acquired accounts.
